It learns what you actually burn
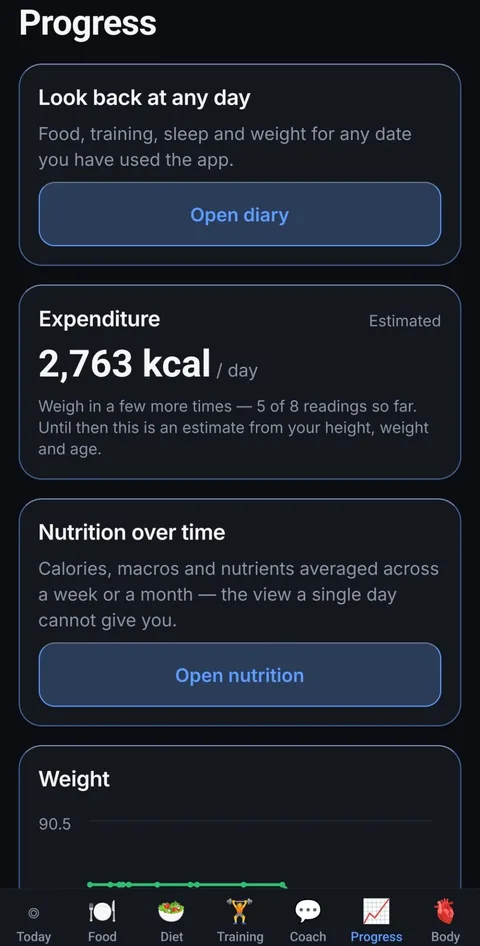
The Mifflin–St Jeor equation is a population average. For an individual it can be out by several hundred calories a day, which is the difference between losing half a kilo a week and losing nothing at all.
After a couple of weeks, Setpoint has something better than an average: you. It fits a trend line through your weigh-ins, compares it against what you ate, and reads your expenditure straight off the energy balance.
Until there is enough data it says so plainly, and blends toward the figure your data points to as the evidence builds, rather than lurching one morning and quietly changing your targets.
How the estimate settles
A mistyped weight cannot move it. Physically impossible results are rejected, not averaged in.
Know when your expenditure has moved
Somewhere around week six, a lot of diets slow down. Most people conclude they have lost discipline, eat less, and stall harder. Often what has changed is their expenditure — partly because a lighter body costs less to run, and sometimes by more than that alone explains.
Setpoint works out your expenditure twice, once at the start and once now, then subtracts the part explained by simply being lighter. A smaller body costs less to run. That is arithmetic, not adaptation. What is left over is a change worth knowing about, and it is one no app built on a formula can see, because a formula only moves when your weight does.
Seeing it is the point. A stall you can name is a different problem from a stall you blame yourself for.
WEEK 9
Your expenditure has fallen further than expected
Your expenditure has fallen 130 kcal beyond what losing 5.4 kg accounts for. A drop like this can reflect training, daily movement, stress, sleep or how closely the logging matched the eating — not only metabolic adaptation. Setpoint shows you the change and what it is not explained by; what to do about it is a conversation for you and, if it persists, someone qualified.
Needs about eight weeks of logging before it can compare two windows.
It notices when your expenditure moves
A fall in expenditure caused by being lighter is normal arithmetic. A fall beyond that is worth knowing about, and Setpoint separates the two so you can see which you are looking at rather than assuming the worst.
You can also tell it a stretch of days was not you — gastro, a holiday, a week of antibiotics. Those days are left out entirely rather than fudged, so the estimate says it is less sure rather than pretending nothing was lost.
The scale isn’t telling the whole story
Carbohydrate is stored as glycogen, and glycogen carries water with it. Salt shifts water too. So after a high-carb or salty day the scale can jump even when you have not gained meaningful body fat — gaining a kilogram of fat takes a large sustained energy surplus, roughly 7,700 kcal by the usual estimate, which one evening does not supply.
Setpoint shows you what is likely behind the movement: how much glycogen and associated water your recent carbohydrate could be carrying, alongside the last seven days of your own intake. Instead of seeing “+400 g” and guessing, you can see what changed in the days before it. Scroll back through the diary and it shows the same picture for any previous day.
And once you have logged enough morning weigh-ins, it stops relying on textbook averages and starts measuring your response. Some people see large swings after a high-carb day. Others barely move. Setpoint works out which pattern looks like yours.
The scale is measuring your weight. Setpoint helps you understand it.
Stop guessing what you burn.
Two weeks of honest logging is all it takes to start replacing a formula with your own data.